
If you've ever searched for "What does a Data Analyst actually do?", you've probably found answers like:
Technically, all of these are correct.
But they don't answer the real question.
What happens between logging into the office in the morning and shutting down the laptop in the evening?
What occupies those eight or nine hours?
Do analysts spend the whole day writing SQL?
Are they constantly building Power BI dashboards?
Do they attend meetings all day?
Or are they doing something completely different?
By the end of this guide, you'll understand exactly how a Data Analyst spends a typical day, why every task matters, and how each activity helps a business make better decisions.
Whether you're planning to become a Data Analyst or simply curious about the profession, this article will show you what the job really looks like.

Let's begin with a simple question.
Imagine you own a restaurant.
Every day, hundreds of customers visit.
They order different meals.
Some pay online.
Some pay cash.
Some leave happy.
Some never return.
By the end of the month, you have thousands of rows of information.
But information alone doesn't answer questions like:
This is where a Data Analyst comes in.
A Data Analyst turns raw data into useful information that helps businesses make smarter decisions.
A Data Analyst collects, cleans, transforms, analyzes, visualizes, and communicates data to identify patterns, answer business questions, and support strategic decision-making.
Companies like Amazon don't guess which products customers want.
They analyze billions of data points every day before making decisions.
Did You Know?
The majority of a Data Analyst's time is not spent creating charts. In many organizations, analysts spend more time understanding business problems and preparing data than building dashboards.
Many beginners think this is the job:
Receive Data
↓

Create Dashboard
↓

Done
Reality looks more like this:
Business Problem
↓

Understand the Question
↓

Find Data

↓

Clean Data

↓

Validate Data

↓

Analyze Data

↓

Discuss Findings

↓

Build Dashboard

↓

Present Insights

↓

Measure Business Impact
The dashboard is often one of the final steps—not the first.
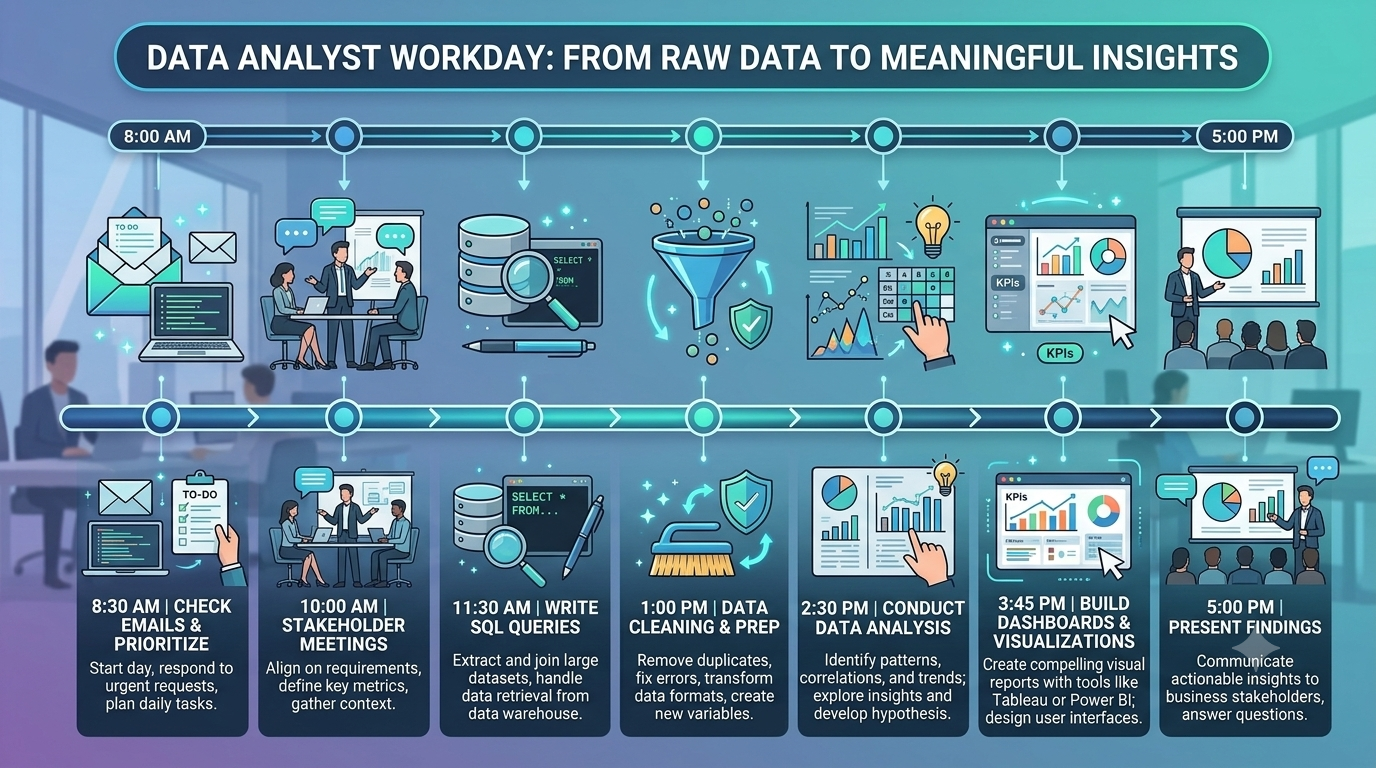
Let's walk through a typical workday.
Keep in mind that every company is different, but the overall workflow is surprisingly similar.
Most analysts don't immediately open Power BI or SQL.
Instead, they check communication tools like:
Why?
Because business priorities change every day.
A manager might ask:
"Yesterday's sales look unusually low. Can you investigate?"
Or marketing might say:
"Our latest campaign isn't performing well."
These questions become the analyst's tasks for the day.
The day starts by understanding what business problem needs attention.
Analysts prioritize requests, review project status, identify blockers, and align their work with business objectives before performing technical analysis.
A retail company notices online orders dropped by 18% yesterday.
Before writing a single SQL query, the analyst first understands:
Without context, data can be misleading.

This is arguably the most important part of the day.
Good analysts don't jump into Excel.
They ask questions.
Lots of questions.
For example:
"We want to increase sales."
Sounds simple.
But an experienced analyst immediately asks:
These questions prevent weeks of unnecessary work.
Myth vs Fact
Myth: Great Data Analysts know SQL better than everyone else.
Fact: Great Data Analysts understand business problems better than everyone else.
Now the investigation begins.
A company may have data stored in dozens of systems.
For example:
Finding the correct dataset is often harder than analyzing it.
The analyst identifies where the required information lives.
Analysts determine appropriate data sources, validate ownership, verify freshness, and ensure data quality before beginning analysis.
If management asks:
"Which customers bought laptops after purchasing smartphones?"
The answer might require combining data from:
One database alone may not be enough.

This is where many people imagine analysts spend their entire day.
In reality, SQL is simply a tool for retrieving information.
A Data Analyst may write queries to answer questions like:
SQL helps transform millions of rows into meaningful answers.
SQL helps analysts ask questions directly to a database.
Structured Query Language (SQL) enables analysts to retrieve, join, filter, aggregate, and transform structured data efficiently from relational databases.
Instead of manually opening 50 Excel files, a single SQL query can summarize millions of transactions in seconds.
Quick Summary
SQL isn't the job.
SQL is the language analysts use to communicate with data.

Imagine you're making a cup of tea.
You carefully choose the best tea leaves, boil fresh water, and add milk and sugar. But just before drinking it, someone drops a spoonful of sand into the cup.
Would you still drink it?
Probably not.
Data works the same way.
Even the best analysis becomes useless if the underlying data is incorrect, incomplete, or inconsistent.
That's why experienced analysts often say:
"Garbage In, Garbage Out (GIGO)."
It means if poor-quality data goes into your analysis, poor-quality decisions come out.
In fact, many analysts spend 40–60% of their time cleaning and preparing data rather than creating dashboards.
Data cleaning means fixing errors before analyzing the data.
Data cleaning involves identifying and resolving missing values, duplicate records, inconsistent formatting, incorrect data types, invalid entries, and outliers to improve data quality and reliability.
Imagine an e-commerce company records these customer names:
| Customer Name |
|---|
| John Smith |
| john smith |
| JOHN SMITH |
Although they represent the same person, the database sees three different customers.
Without cleaning the data, management may incorrectly believe they have three customers instead of one.
A Data Analyst may spend hours:
For example:
A person's age cannot realistically be 250 years.
A product cannot have a price of –₹500.
These are data quality issues—not business insights.
Did You Know?
Some organizations have dedicated Data Quality Teams, but Data Analysts are still responsible for verifying that the data they use is trustworthy.

Now comes one of the most interesting parts of the job.
This stage is called Exploratory Data Analysis (EDA).
Instead of answering a specific question immediately, analysts become detectives.
They start asking questions like:
EDA is less about proving something and more about discovering something.
Exploratory Data Analysis means getting familiar with your data before making conclusions.
EDA uses descriptive statistics, visualization, aggregation, and profiling techniques to identify distributions, trends, anomalies, correlations, and potential hypotheses.
Netflix may notice that users who watch documentaries on weekdays often switch to comedy movies during weekends.
Nobody asked that question.
EDA helped discover it.
Every answer leads to another question.
That curiosity is what separates average analysts from exceptional ones.

Many beginners think Excel is "too basic."
The truth is quite the opposite.
Even in large multinational companies, Excel remains one of the most widely used analytics tools because it's flexible, fast, and familiar to business users.
An analyst might use Excel to:
Excel helps analysts quickly understand and organize data.
Excel supports data transformation, aggregation, lookup functions, PivotTables, conditional formatting, forecasting, and lightweight analytical modeling.
Suppose the Sales Manager wants a report within 10 minutes.
Opening Power BI, connecting databases, and publishing dashboards may take longer than simply using a Pivot Table.
The fastest solution is often the best solution.
Myth vs Fact
Myth: Professional Data Analysts don't use Excel.
Fact: Professional Data Analysts use the best tool for the problem—and Excel is often that tool.

Not every Data Analyst writes Python every day.
Whether Python is used depends on the company, project, and dataset size.
For smaller tasks, SQL and Excel are often enough.
For larger or more complex problems, Python becomes incredibly valuable.
Python automates repetitive work and analyzes large datasets efficiently.
Python enables data manipulation, automation, statistical analysis, machine learning, API integration, and advanced visualization through libraries such as Pandas, NumPy, Matplotlib, and Scikit-learn.
Imagine downloading 300 Excel files every Monday.
Doing it manually may take three hours.
A Python script can finish the same work in less than two minutes.
That's why automation is one of Python's greatest strengths.
Remember:
Python is not mandatory for every Data Analyst, but learning it opens many more career opportunities.
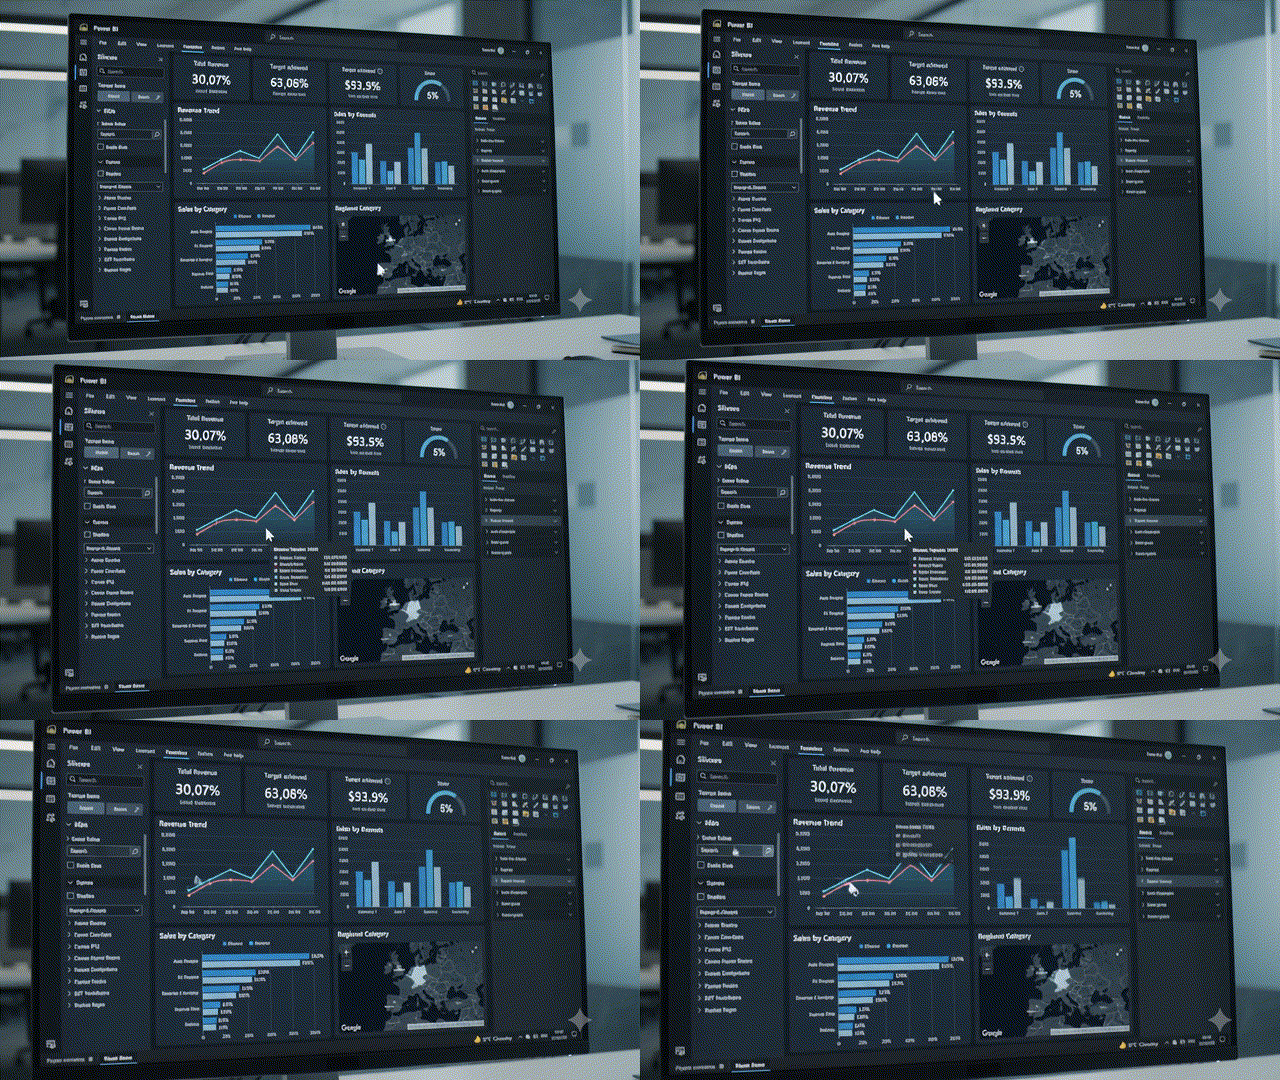
This is the part most people recognize.
After understanding the business problem, collecting the data, cleaning it, and analyzing it, the analyst finally builds dashboards.
Notice how dashboard creation happens near the end of the workflow—not at the beginning.
A dashboard is simply a way of communicating insights.
It is not the insight itself.
Dashboards help people understand data quickly.
Business Intelligence dashboards consolidate KPIs, trends, filters, drill-down capabilities, and visualizations into an interactive decision-support system.
A CEO doesn't have time to read a 200-page report.
Instead, they might look at a dashboard for 30 seconds and instantly know:
Good dashboards save time.
Great dashboards improve decisions.
A good dashboard answers questions instead of creating new ones.
It should be:
The best dashboards often look surprisingly simple.
Common Mistake
Beginners try to use every chart type available.
Experienced analysts choose the fewest visuals needed to tell the story clearly.

Finding an insight is only half the job.
Communicating it is equally important.
Imagine discovering that delivery delays reduce customer satisfaction by 25%.
If nobody understands your findings, your analysis creates no business value.
This is why analysts regularly present their work to stakeholders.
Stakeholders may include:
Each audience requires a different style of communication.
A CEO wants business impact.
An engineer wants technical details.
A marketing manager wants campaign performance.
Great analysts know how to adjust their message for each audience.
Analysts explain what the data means and what should happen next.
Analysts translate technical findings into business recommendations, enabling stakeholders to make informed, evidence-based decisions.
Instead of saying:
"Conversion dropped by 8.4%."
An effective analyst says:
"Our checkout page update likely caused the decline. Restoring the previous version could recover approximately ₹12 lakh in monthly revenue."
One is a statistic.
The other is a business decision.
The work doesn't end after sending a dashboard.
Experienced analysts ask one final question:
"Did our analysis actually improve the business?"
If recommendations increased sales, reduced costs, improved customer satisfaction, or saved employee time, the project was successful.
If nothing changed, the analysis needs improvement.
The ultimate goal of a Data Analyst is not to build reports.
The goal is to help organizations make better decisions.
By the end of a typical day, a Data Analyst may have:
Notice something?
Only one of these tasks involved creating dashboards.
Everything else focused on solving business problems.
That is what Data Analytics is really about.

You finally finish your dashboard.
The charts look great.
The numbers are verified.
You're about to take a short break.
Then a message pops up.
"The CEO needs this report in 30 minutes."
Welcome to the real world of Data Analytics.
Business priorities can change quickly.
An urgent customer issue, a sudden drop in sales, a website outage, or an investor meeting can instantly become the highest priority.
Experienced analysts don't panic.
They prioritize.
Sometimes that means pausing one project to solve another problem that has a bigger business impact.
Not every day goes according to plan.
Data Analysts constantly balance planned work with ad hoc requests, changing business priorities, and time-sensitive analyses that support operational and strategic decisions.
Imagine an online shopping website suddenly notices a 35% drop in completed orders.
The marketing campaign isn't the priority anymore.
Finding the cause of the drop becomes everyone's priority because every passing minute could mean lost revenue.
Did You Know?
Some of the most valuable analyses are never planned. They begin with a simple message like:
"Something doesn't look right. Can you investigate?"

Many beginners imagine Data Analysts working quietly with headphones on all day.
Reality is different.
Communication is a major part of the role.
Depending on the company, analysts may attend several short meetings throughout the week.
Some meetings are only 15 minutes.
Others may last an hour.
Each has a different purpose.
Before starting any analysis, analysts need clarity.
Instead of immediately opening SQL, they ask questions like:
A good question at the beginning can save days of unnecessary work later.
In Agile teams, analysts often join a short daily meeting.
Everyone quickly answers three questions:
These meetings help the entire team stay aligned.
Once a dashboard is ready, analysts don't simply send a link.
They demonstrate it.
Stakeholders ask questions.
Sometimes they request additional filters.
Sometimes they realize they need a different metric altogether.
Feedback is expected.
Dashboards evolve over time.

One of the biggest surprises for beginners is how many people a Data Analyst works with.
Think of the analyst as a translator.
One side speaks business.
The other side speaks data.
The analyst helps both sides understand each other.
Marketing teams may ask:
The analyst provides answers backed by data instead of assumptions.
Sales managers often want to know:
These insights help improve revenue.
Finance teams focus on questions like:
Accurate analysis helps companies spend money wisely.
Product Managers constantly ask:
Instead of guessing, they rely on evidence.
Support teams collect thousands of customer complaints.
Analysts help identify patterns such as:
Small improvements discovered through data can significantly improve customer experience.

This is what truly separates experienced analysts from beginners.
The difference isn't a programming language.
It's the questions they ask.
Suppose someone says:
"Sales dropped by 15%."
A beginner might immediately create a chart.
An experienced analyst becomes curious.
They ask:
One statement becomes ten new questions.
That's analytical thinking.
Remember
Good analysts answer questions.
Great analysts discover the questions nobody thought to ask.
Imagine spending three days creating the world's most beautiful dashboard.
Animated charts.
Fancy colors.
Modern design.
But nobody changes a business decision after seeing it.
Did the dashboard create value?
Probably not.
Now imagine another dashboard.
It's simple.
Only four charts.
No fancy animations.
But after reviewing it, management discovers a manufacturing problem that saves ₹2 crore every year.
Which dashboard is better?
The second one.
Because business value is more important than visual beauty.
| What Many Beginners Think | What Actually Happens |
|---|---|
| I'll build dashboards every day. | Dashboards are only one part of the job. |
| I'll spend all day writing SQL. | Understanding business problems often takes longer. |
| My job is creating reports. | My job is helping people make better decisions. |
| Data speaks for itself. | Analysts must explain what the data means. |
| I'll mostly work alone. | Analysts collaborate with many different teams every week. |
One reason many people enjoy Data Analytics is that the work keeps changing.
On Monday, you might investigate falling sales.
On Tuesday, you could build a dashboard for HR.
On Wednesday, Marketing may ask for campaign insights.
On Thursday, Finance may need a profitability report.
On Friday, you might present everything to senior leadership.
The tools may stay the same.
The business questions rarely do.
That constant variety keeps the role interesting.
When software developers finish a feature, they can point to the code they wrote.
When designers finish a project, they can show the interface they created.
For Data Analysts, success looks different.
A successful day isn't measured by:
It's measured by questions answered.
Problems solved.
Decisions improved.
If someone leaves a meeting saying,
"Now I know what to do."
The analyst has done their job.
That is the real purpose of Data Analytics.
